METHODS
Studies involving diode array spectrophotometry and 13C-NMR analysis with metformin, PC, and other related inputs and products of gluconeogenesis were conducted in order to ascertain the enzymatic effect of metformin on gluconeogenesis. These studies were performed with assistance, supplies, and lab space provided by the Department of Chemistry and Biochemistry at the University of Northern Colorado, Greeley.
Diode Array Spectrophotometry of PC
Assays of PC and metformin were prepared for analysis in a diode array spectrophotometer provided by the University of Northern Colorado Department of Chemistry and Biochemistry. Protocol for these assays was modified from several pre-existing procedures (Bahl et al., 1997; Duggelby et al., 1982; Jitrapakdee et al., 2008; Warren and Tipton, 1974). Several reagents were prepared for the enzyme-coupled reaction, including reaction cocktail, PC solution, ATP Sodium Bicarbonate solution, and metformin solution. Assays were run in order to determine the activity of purified bovine PC in the presence and absence of metformin. Metformin was added to test assays in concentrations above, below, and consistent with normal pharmacokinetic concentrations. Conditions among all assays such as temperature, volume, spectrophotometry conditions, pH, etc. were kept constant throughout the experiment.
Reaction Cocktail Preparation.
A reaction cocktail comprising of several different solutions was prepared and added to each assay of the spectrophotometry. 72.7% of the cocktail volume was comprised of a solution containing 135 mM Triethanolamine Buffer (TEA), 7mM Magnesium Sulfate, 9 mM Pyruvic Acid, and 0.15% (w/v) Bovine Serum Albumin in deionized water (diH2O), maintained at a pH of 8.0 and a temperature of 30° C with 1 M HCl to maintain pH balance as needed. 18.2% of the cocktail volume was comprised of a solution containing 150 units of Malic Dehydrogenase in equal volumes of diH2O and 0.3 mM Acetyl Coenzyme A solution prepared in diH2O. The remaining 9.1% of the cocktail volume was comprised of a solution containing 26 mM ß-Nicotinamide Adenine Dinucleotide, Reduced Form (ß-NADH) in diH2O. This solution was stored on ice.
PC Solution Preparation
PC solution was prepared by adding 32.5 units/ml of PC to cold buffer consisting of 50mM Tris HCl buffer, 50% (v/v) Glycerol, 2 mM Magnesium Acetate, and 1 mM Ethylenediaminetetraacetic Acid (EDTA) in diH2O at a temperature of 30° C and a pH of 7.4 maintained by 1 M KOH as needed. This solution was stored on ice.
ATP/NaHCO3 Solution Preparation
A solution of 135 mM TEA, 30 mM Adenosine 5’ Triphosphate (ATP) , and 450 mM Sodium Bicarbonate in diH2O was prepared. Temperature was maintained at 30° C and a pH level of 8.0 was maintained with 1 M KOH. This solution was stored on ice.
Metformin Solution Preparation
Solutions of metformin were prepared at concentrations of 5000µM, 2500µM, 500µM, and 250µM using powdered metformin and diH2O. These solutions were stored on ice.
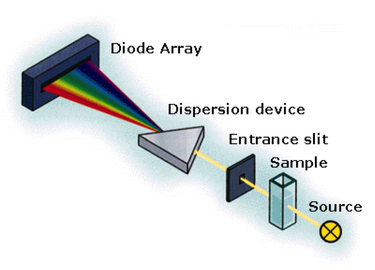
Diode Array Spectrophotometry
The spectrophotometer was allowed to equilibrate for at least 30 minutes before use. After equilibration, the spectrophotometer was blanked with a 1 ml, clean cuvette containing 900µL of reaction cocktail, 5µL of Tris/EDTA buffer (50mM Tris HCl buffer, 50% (v/v) Glycerol, 2 mM Magnesium Acetate, and 1 mM EDTA in diH2O), and 100µL of ATP/NaHCO3. The assay temperature was maintained at 30° C with a total run time of 1 minute and a cycle time of 5 seconds. In order to blank the spectrophotometer, a 1 mL cuvette was cleaned with a KimWipe, appropriate volumes of solutions were pipetted into the cuvette such that the final solution was appropriately concentrated, the cuvette was again cleaned with a KimWipe, the cuvette was inserted into the diode array spectrophotometer, and the assay reading was initiated by selecting the appropriate icon on the connected computer. After an appropriate graph for the blank was obtained, the cuvette was removed and a new assay was run with the same protocol. For test assays, 800µL of reaction cocktail, 5µL of PC solution, 100µL of ATP/NaHCO3 solution, and 100µL of the appropriate concentration of metformin solution were added to a 1 mL cuvette, and the assay was run as normal. For control assays, 900µL of reaction cocktail, 5µL of PC solution, and 100µL of ATP/NaHCO3 solution were added to a 1 mL cuvette. The cuvettes were cleaned out with diH2O and acetone after assays were run. In total, 9 test assays and 3 control assays were run.
Analysis of Diode Array Spectrophotometry Data
Beer’s Law was used to analyze spectrophotometry data such that useful information regarding the concentration of NADH and the PC reaction rate under the influence of metformin could be determined.

Reaction rate data from the diode array spectrophotometry was graphed in Microsoft Excel, and a line of best fit was found using linear regression. The slope of this line was considered “A” in the above equation. Using this equation, c, or concentration of NADH, was calculated for each assay. These calculations were performed for each assay in order to determine a rate for the reaction and a concentration value for NADH.
13C-NMR Analysis
13C-NMR analysis was performed in order to identify the structures of biotin, oxaloacetate, pyruvate, as well as biotin mixed with metformin, oxaloacetate mixed with metformin, and pyruvate mixed with metformin. Each substance was dissolved in 1 mL of deuterium oxide (D2O Sigma-Aldrich, 99.9 % analytical grade) and heated in a water bath to a temperature of 32-36° C for 10 minutes. For samples consisting of two substances (metformin mixed with sample substances), equal volumes of each substance were mixed and similarly heated in a water bath to a temperature of 32-36° C for 10 minutes. Final samples for NMR analysis consisted of 450µL of sample solution added to 150µL of D2O. 13C-NMR was run using the Bruker Avance I 360 MHz FT-NMR spectrometer provided by the University of Northern Colorado Department of Chemistry and Biochemistry. The 13C-NMRs were maintained at ambient temperature. 15,000 scans were taken per NMR overnight. Graphs were obtained and printed, and the resulting peaks were analyzed in order to ascertain changes to the functional groups of pyruvate, oxaloacetate, and biotin under metformin interaction.
Statistical Analysis
NADH concentrations obtained from Beer’s Law calculations for six groups (i.e., group 1 = control, group 2 = 1000µM, group 3 = 2500µM, group 4 = 250µM, group 5 = 5000µM, group 6 = 500µM) were compared. A test of one-way analysis of variance (ANOVA) through the SAS 9.4 statistical program (Cary, NC) was performed. Further, if the ANOVA was significant, the Duncan-Waller’s post hoc analysis was performed to determine which groups differed significantly.
